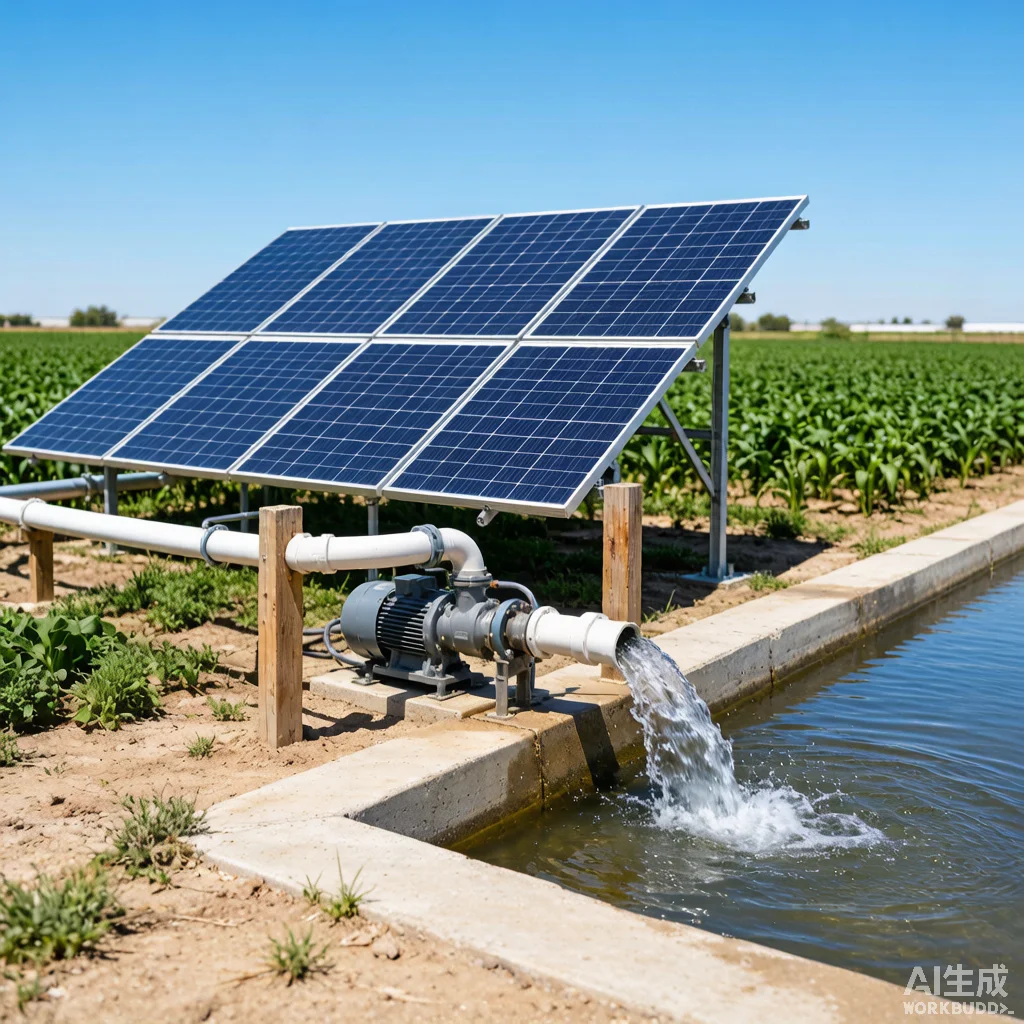
Solar Water Pump ROI Analysis: How Quickly Can You Recoup Your Investment?
Introduction
Every procurement decision in the water pumping industry ultimately comes down to one question: how quickly does this investment pay for itself? For B2B buyers—whether you are a farm cooperative manager in Kenya, a municipal water engineer in the Philippines, or an agricultural project developer in Brazil—the shift from diesel or grid-powered pumps to solar represents one of the highest-ROI infrastructure decisions available today. A well-sized solar water pump system typically recovers its full capital cost within 2 to 4 years through eliminated fuel expenses alone, then continues delivering free water for another 8 to 10 years. Manufacturers such as KINBO have refined solar pump technology to the point where the economic case is no longer debatable—it is simply a matter of selecting the right system size and understanding your specific payback timeline.
Table of Contents
Understanding Solar Pump ROI Fundamentals
The Simple Math Behind Solar Pump Economics
The ROI calculation for a solar water pump system rests on three variables: upfront capital cost, annual operational savings, and system lifespan. Unlike diesel pumps—which incur continuous fuel, lubricant, and maintenance expenses—a solar pump’s operational costs are near zero after installation. The solar PV array generates electricity at zero marginal cost for 25+ years, and the pump itself requires only periodic inspections and occasional bearing replacement. This fundamental asymmetry between capital-intensive solar and expense-intensive diesel is what drives the compelling payback math.
The standard formula used by project planners is straightforward:
Payback Period (years) = Upfront System Cost ÷ Annual Diesel Savings
For a typical 5 kW system serving a mid-size farm, the annual diesel savings range from $2,800 to $5,200 depending on local fuel prices and daily pumping hours, producing payback periods of 2 to 3.5 years. For context, this is faster than the payback on most commercial solar PV roof installations and dramatically faster than any other agricultural capital investment of comparable scale.
Factors That Influence Your Specific ROI
- Local diesel price — The single largest variable. Regions with subsidized fuel (e.g., $0.50/L) see longer payback periods of 4-5 years; regions with market-rate diesel ($1.00-1.40/L) see payback in 2-3 years.
- Daily pumping hours — More pumping hours = more fuel displaced = faster payback. A pump running 8 hours daily recovers costs twice as fast as one running 4 hours.
- Solar irradiance — Annual average peak sun hours (PSH) determine how much water your system can deliver. Locations with 5.5+ PSH (sub-Saharan Africa, Middle East, Northern Australia) achieve optimal economics.
- System sizing accuracy — Oversizing increases upfront cost without proportional water output gain; undersizing leaves fuel savings on the table. Professional sizing to match your well depth, daily water demand, and local irradiance is essential.
- Financing terms — Low-interest development finance (3-5% APR) can make solar pump projects cash-flow positive from month one, even before accounting for fuel savings.
Capital Cost Breakdown by System Size
The following table presents FOB equipment costs for complete solar submersible pump systems across the three most common power ratings for agricultural and community water supply applications. All figures include the pump unit, MPPT controller, solar PV panels, mounting structure, cables, and safety accessories.
| System Size | 1.5 kW (Small Farm) | 5 kW (Medium Farm) | 15 kW (Community/Large Farm) |
|---|---|---|---|
| Pump Unit (incl. controller) | $650 | $1,850 | $4,200 |
| Solar PV Panels | $1,050 (2.2 kWp) | $3,200 (7 kWp) | $9,100 (20 kWp) |
| Mounting Structure + Cables | $350 | $850 | $2,200 |
| Installation & Commissioning | $400 | $900 | $2,000 |
| Total System Cost (FOB + install) | $2,450 | $6,800 | $17,500 |
| Daily Water Output (5.5 PSH, 50 m head) | 18 m³ | 65 m³ | 210 m³ |
Note: Prices are indicative FOB China, Q4 2026 estimates. Actual quotes depend on specific model selection, order quantity, and shipping destination. Contact KINBO for a project-specific quotation.
Operational Savings: Solar vs Diesel Pumps
Diesel pumps consume approximately 0.30-0.35 liters of fuel per kilowatt-hour of mechanical output. For a 5 kW pump running 6 hours daily, this translates to roughly 6 liters per day—or 2,190 liters per year. At a diesel price of $1.10/L (typical for East Africa in 2026), annual fuel costs alone reach $2,409. Add $350-500 for engine oil, filters, belts, and routine servicing, and the total annual operating cost of a diesel pump approaches $2,800-$3,000. In contrast, a solar pump’s annual operating cost is essentially the labor for periodic inspection—typically under $100 per year.
| Annual Cost Item | 5 kW Diesel Pump | 5 kW Solar Pump | Annual Saving |
|---|---|---|---|
| Fuel (Diesel @ $1.10/L) | $2,409 | $0 | $2,409 |
| Lubricants & Consumables | $350 | $0 | $350 |
| Routine Maintenance | $480 | $80 | $400 |
| Spare Parts (annualized) | $260 | $20 | $240 |
| Total Annual Operating Cost | $3,499 | $100 | $3,399 |
At $3,399 in annual savings, a $6,800 solar pump system achieves full payback in exactly 2.0 years. From year 3 onward, the system delivers net positive cash flow of over $3,300 annually—a return on invested capital that few other infrastructure investments can match. For a deeper understanding of pump technology selection, see our guide on how solar water pumps work.
Payback Period Analysis by Region
Payback periods vary significantly by geography due to differences in diesel pricing, solar irradiance, and labor costs. The following analysis models a 5 kW system across four representative markets.
| Region | Diesel Price (USD/L) | Annual Sun Hours (PSH) | Annual Savings | Payback Period |
|---|---|---|---|---|
| East Africa (Kenya, Tanzania) | $1.15 | 5.5 | $3,550 | 1.9 years |
| Middle East (Yemen, Sudan) | $0.65 | 6.0 | $2,100 | 3.2 years |
| South Asia (India, Bangladesh) | $1.05 | 5.0 | $3,100 | 2.2 years |
| West Africa (Nigeria, Ghana) | $0.85 | 5.3 | $2,750 | 2.5 years |
| Southeast Asia (Philippines, Indonesia) | $0.95 | 4.8 | $2,850 | 2.4 years |
Note: Payback calculations assume 6 daily pumping hours and FOB equipment cost of $6,800 for a 5 kW system. Local installation labor, import duties, and transportation costs may extend payback by 0.3-0.6 years depending on the destination country.
Hidden Value Drivers Beyond Fuel Savings
While displaced diesel costs dominate the financial case, experienced project developers recognize several additional value streams that traditional ROI calculations often overlook. These factors can substantially improve the real-world economics of solar pumping.
Reduced Downtime and Production Continuity
Diesel pumps in remote agricultural areas suffer from fuel supply chain disruptions—delayed deliveries, price gouging during shortages, and adulterated fuel that damages engines. A 2025 survey of 400 smallholder farms in Tanzania found that diesel pump users experienced an average of 23 days per year of unplanned downtime due to fuel unavailability or mechanical failure. Solar pumps eliminate this risk entirely, preserving crop yields during critical irrigation windows.
Labor Cost Reduction
Operating a diesel pump requires daily refueling, oil level checks, and manual start/stop procedures—typically consuming 1-2 hours of labor per day. Solar pumps with automatic controllers eliminate this labor entirely. At a modest labor rate of $3/hour, this saves $1,100-2,200 per year in personnel costs alone.
Carbon Credit Revenue (Emerging)
Solar water pumps that displace diesel consumption generate verifiable carbon emission reductions. A 5 kW solar pump avoiding 2,190 liters of diesel annually abates approximately 5.8 tonnes of CO₂ equivalent per year. With voluntary carbon credit prices ranging from $8-15 per tonne in 2026, this represents an additional $46-87 in annual revenue—modest today but projected to grow as compliance carbon markets expand in developing economies.
Extended Equipment Lifespan
Solar pumps operating at variable speed through MPPT controllers experience lower mechanical stress than diesel engines running at constant RPM. The resulting 30-50% longer service life defers replacement capital expenditure, effectively reducing the annualized cost of the pump asset. KINBO solar submersible pumps are engineered with 316 stainless steel impellers and ceramic bearings specifically to maximize this longevity advantage in demanding field conditions.
Frequently Asked Questions
Q: What is the minimum system size where solar pumping becomes economically viable?
A: Solar pumping delivers positive ROI at any scale where diesel is the alternative. Even a 0.5 kW DC solar pump serving 2-3 hectares of drip irrigation with a $900 system cost pays back in under 2 years when displacing $500-600 in annual diesel and maintenance expenses. There is no minimum viable scale—the economics work from the smallest smallholder farm to the largest commercial operation.
Q: How do I account for cloudy seasons in my ROI calculation?
A: Proper system sizing accounts for seasonal irradiance variation. Design your system for the lowest-irradiance month in which pumping is required, not the annual average. A well-sized system will deliver your target water volume even during the rainy season, albeit with longer daily run time. For regions with pronounced monsoon seasons, AC/DC hybrid pumps with grid backup provide insurance at a modest premium that should be factored into the ROI model.
Q: Can I finance a solar pump system through development programs?
A: Yes. Multiple multilateral and bilateral development finance programs offer concessional financing for solar irrigation. The World Bank’s SIRP program, AfDB’s Technologies for African Agricultural Transformation (TAAT), and various national agricultural development banks provide loans at 3-6% APR with 2-3 year grace periods. KINBO can provide the technical specifications and pro-forma invoices required for these financing applications.
Q: What happens to ROI if diesel prices fall significantly?
A: Even at $0.50/L diesel—well below any major market’s 2026 price—a 5 kW solar pump still saves approximately $1,500 annually in fuel plus $600 in maintenance, yielding a 4.5-year payback. Given that solar panels are warrantied for 25 years and pumps last 10+ years, a 4.5-year payback still delivers a 10-year ROI exceeding 120%. Solar pumping remains economically rational across the entire realistic range of diesel pricing.
For B2B buyers evaluating solar water pump investments for agricultural, community, or industrial applications, contact KINBO for competitive FOB pricing, customized ROI modeling, and technical specification support.