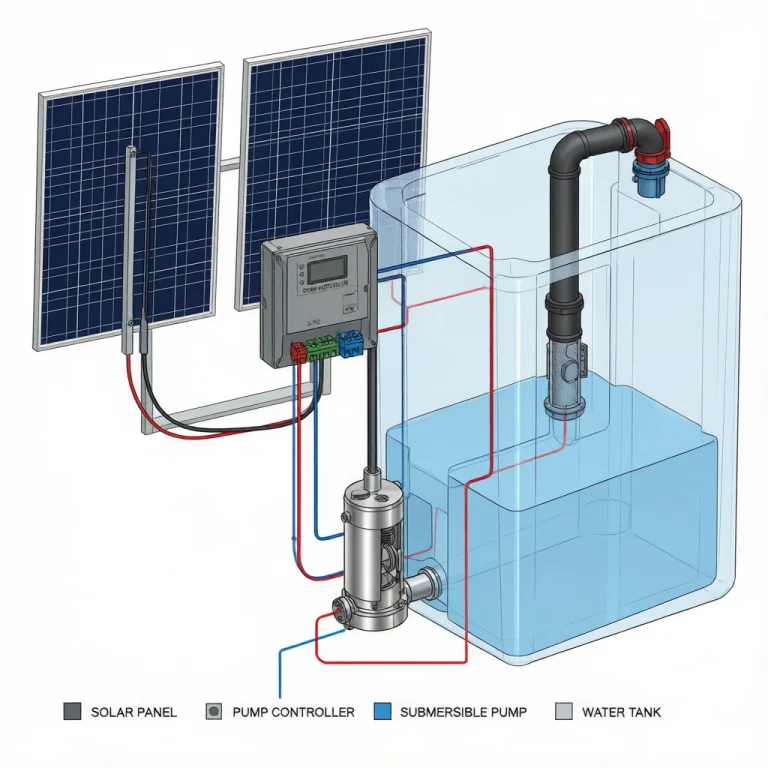
Solar Pump Pipeline Friction Loss Calculation and Design Optimization
Introduction
When designing a solar water pumping system, pipeline friction loss is one of the most critical—and frequently underestimated—factors affecting overall performance. Every meter of pipe between your pump and the delivery point creates resistance that reduces the effective head your pump must overcome. For off-grid solar installations where every watt of solar panel capacity matters, ignoring friction loss can mean the difference between a system that delivers water reliably and one that falls short on cloudy days.
At KINBO, we have supported thousands of solar pump installations across more than 60 countries, and pipeline design errors remain the single most common cause of underperformance in field deployments. Whether you are pumping from a borehole to a storage tank 500 meters away or distributing irrigation water across a farm, accurate friction loss calculation ensures you select the right pump head, pipe diameter, and solar array size. In this guide, we walk through the engineering formulas, provide a fully worked calculation example, and offer practical optimization strategies. For broader context on matching pump specifications to your application, see our guide on how to calculate required head for solar pump selection.
Table of Contents
Understanding Friction Loss in Solar Pump Pipelines
Friction loss (also called head loss) is the energy dissipated as water moves through a pipe due to the viscous shear between the fluid and the pipe wall. In solar pump systems, this loss directly reduces the pressure available at the discharge point, meaning your pump must work harder—and consume more solar power—to deliver the same flow rate.
Two principal formulas are used in pipeline friction loss calculations:
Hazen-Williams Equation:
hf = 10.67 × L × Q1.852 / (C1.852 × D4.87)
Where:
- hf = friction head loss (m)
- L = pipe length (m)
- Q = flow rate (m³/s)
- C = Hazen-Williams roughness coefficient (150 for new HDPE, 130 for PVC, 100 for old steel)
- D = internal pipe diameter (m)
Darcy-Weisbach Equation:
hf = f × (L/D) × (v²/2g)
Where f is the Darcy friction factor (determined from the Moody chart or Colebrook equation), v is flow velocity (m/s), and g is gravitational acceleration (9.81 m/s²). The Darcy-Weisbach equation is more theoretically rigorous and works across all fluid types and flow regimes, while Hazen-Williams is simpler and widely used for water-only applications at typical velocities.
Key factors affecting friction loss include:
- Pipe diameter: Loss scales inversely with D4.87 (Hazen-Williams), so doubling the diameter reduces friction loss by roughly a factor of 29.
- Flow rate: Loss increases with Q1.852, meaning higher flow dramatically increases resistance.
- Pipe material and age: Rougher pipes (old steel, C=100) produce significantly more loss than smooth HDPE (C=150).
- Pipe length: Loss is directly proportional to length—long pipelines accumulate significant head loss.
Step-by-Step Friction Loss Calculation
Let us work through a real-world example using the Hazen-Williams formula.
Scenario: A 1.5 kW solar submersible pump delivers water from a borehole to a storage tank through 500 meters of 50mm HDPE pipe. The required flow rate is 3 m³/h. The static head (vertical lift) is 20 meters.
Step 1 — Convert units to SI:
- Q = 3 m³/h ÷ 3600 = 0.000833 m³/s
- D = 41 mm = 0.041 m (internal diameter of 50mm HDPE PN10 pipe)
- L = 500 m
- C = 150 (new HDPE)
Step 2 — Apply the Hazen-Williams formula:
hf = 10.67 × 500 × (0.000833)1.852 / (1501.852 × 0.0414.87)
hf = 10.67 × 500 × 1.981×10⁻⁶ / (10715 × 1.766×10⁻⁷)
hf = 0.01057 / 0.001893 = 5.58 m
Step 3 — Check flow velocity:
v = 4Q / (π × D²) = 4 × 0.000833 / (π × 0.041²) = 0.63 m/s
This falls within the recommended range of 0.5–2.0 m/s for HDPE pipelines, confirming the pipe size is acceptable.
Step 4 — Add minor losses (estimated at 10% of friction loss for typical installations with a few valves and elbows):
hminor = 0.10 × 5.58 = 0.56 m
Step 5 — Calculate total dynamic head (TDH):
TDH = static head + friction loss + minor losses = 20 + 5.58 + 0.56 = 26.14 m
The pump must therefore deliver 3 m³/h at a minimum of 26.14 m head. Adding a 10% safety margin, the design head should be approximately 29 m. This is the figure you would use when selecting from KINBO‘s solar pump performance curves.
Pipe Diameter Selection and Optimization
Choosing the optimal pipe diameter involves balancing upfront pipe cost against long-term energy savings. A smaller diameter pipe is cheaper to purchase but creates higher friction loss, requiring a more powerful pump and larger solar array. A larger diameter pipe costs more initially but reduces ongoing energy consumption and may allow a smaller, less expensive pump.
The table below compares friction loss and energy cost across four pipe diameters for the same scenario: 3 m³/h flow rate over 500 meters of HDPE pipe, with the pump running 8 hours per day at $0.15/kWh grid-equivalent cost and 50% overall pump efficiency.
| Pipe Diameter (Nominal) | Internal Dia. (mm) | Flow Velocity (m/s) | Friction Loss per 100m (m) | Head Increase for 500m (m) | Annual Energy Cost ($) |
|---|---|---|---|---|---|
| 32mm (1.25″) | 26 | 1.57 | 10.30 | 51.50 | $369 |
| 50mm (2″) | 41 | 0.63 | 1.12 | 5.58 | $40 |
| 75mm (3″) | 61 | 0.28 | 0.16 | 0.79 | $6 |
| 100mm (4″) | 85 | 0.15 | 0.03 | 0.15 | $1 |
The data reveals a striking trade-off: reducing the pipe from 50mm to 32mm increases friction loss by more than 900%, adding $329 in annual energy costs. Conversely, upsizing from 50mm to 75mm saves only $34 per year—a payback period that may exceed the life of a thin-walled pipe. For this flow rate, 50mm HDPE represents the economic sweet spot, keeping velocity within recommended limits while maintaining reasonable friction loss.
As a general rule for solar pump systems, aim for a flow velocity between 0.5 and 2.0 m/s. Below 0.5 m/s, sediment may settle in the pipe; above 2.0 m/s, friction loss and water hammer risk increase sharply.
Fittings and Minor Losses
Beyond straight-pipe friction, every fitting—elbow, valve, coupling, reducer—introduces additional head loss called “minor losses.” In long rural pipelines with few fittings, these may represent only 5–10% of total friction loss. In compact systems with many valves and bends, minor losses can reach 20–30%.
Minor losses are calculated using the K-factor method:
hm = K × (v²/2g)
Where K is the loss coefficient for each fitting and v²/2g is the velocity head. Common K-values include:
- 90° elbow (smooth radius): K = 0.3–0.5
- 90° elbow (sharp/mitred): K = 0.9–1.3
- Gate valve (fully open): K = 0.15–0.2
- Check valve (swing type): K = 0.5–2.5
- Ball valve (fully open): K = 0.04–0.1
- Sudden enlargement: K = 0.5–1.0
- Tee (branch flow): K = 1.0–1.8
To calculate total minor losses, sum the K-values of all fittings and multiply by the velocity head. For our example pipeline (v = 0.63 m/s, velocity head = 0.63²/(2×9.81) = 0.020 m), a system with four 90° elbows (K=0.5 each), one gate valve (K=0.2), and one check valve (K=1.0) would have:
ΣK = (4 × 0.5) + 0.2 + 1.0 = 3.2
hm = 3.2 × 0.020 = 0.064 m
This minor loss of 0.064 m is negligible compared to the 5.58 m pipe friction loss, confirming that for long-distance rural pipelines, straight-pipe friction dominates the calculation.
Frequently Asked Questions
Q1: What is a good friction loss percentage for a solar pump pipeline?
As a rule of thumb, friction loss should not exceed 10–15% of the total dynamic head. If your friction loss exceeds this threshold, consider increasing the pipe diameter. For example, if your static head is 20 m, keep friction plus minor losses below 3 m. In our worked example, the 50mm pipe produces 6.14 m of loss against a 20 m static head—a ratio of 31%, which suggests upsizing to 75mm pipe would be worthwhile for long-term efficiency.
Q2: How does pipe material affect friction loss in solar pump systems?
Pipe material directly determines the Hazen-Williams C coefficient. New HDPE (C=150) and PVC (C=150) offer the lowest friction losses, making them ideal for solar pump installations. Old or corroded steel pipe (C=100) can increase friction loss by 200–300% compared to HDPE. Over time, mineral buildup in steel and concrete pipes further reduces the effective diameter, compounding losses. For solar applications where energy is at a premium, always specify smooth-wall HDPE or PVC.
Q3: Can I reduce friction loss without replacing the entire pipeline?
Yes, several strategies can help. First, eliminate unnecessary fittings—each removed elbow or valve saves head. Second, ensure valves are fully open during operation; a partially closed gate valve can add several meters of head loss. Third, if the pipeline has segments of smaller-diameter pipe, replacing just those bottleneck sections with larger pipe can yield disproportionate improvements. Finally, consider adding a booster pump for very long pipelines (over 1000 m) where friction loss would otherwise require an impractically large primary pump.
Need Help Optimizing Your Solar Pump Pipeline?
The engineering team at KINBO provides free pipeline design consultation for all solar pump customers. From friction loss calculations to pipe sizing and solar array matching, we help you get the most from your investment. Contact our after-sales service team today for expert support.
August 11, 2026 | Author: KINBO Editorial Team