Solar Pump Flow Rate and Head: Understanding Performance Curves and Selection Criteria
Solar Pump Flow Rate and Head: Understanding Performance Curves and Selection Criteria
Introduction
Selecting the right solar water pump requires a clear understanding of two fundamental performance parameters: flow rate and head. These two variables define whether a pump can deliver the required volume of water to the desired elevation, and they are intimately connected through the pump’s performance curve. For engineers, irrigation planners, and off-grid system designers, reading these curves correctly is the difference between a system that performs reliably for years and one that falls short on the very first sunny day.
KINBO has spent over a decade engineering solar pumping solutions for agriculture, livestock, and rural water supply across more than 60 countries. In this guide, we break down how pump performance curves work, how solar irradiance shifts the operating point, and what practical criteria you should apply when matching a pump to your application. For a broader overview of the selection process, see our companion guide on how to choose a solar water pump.
Table of Contents
Understanding Pump Performance Curves
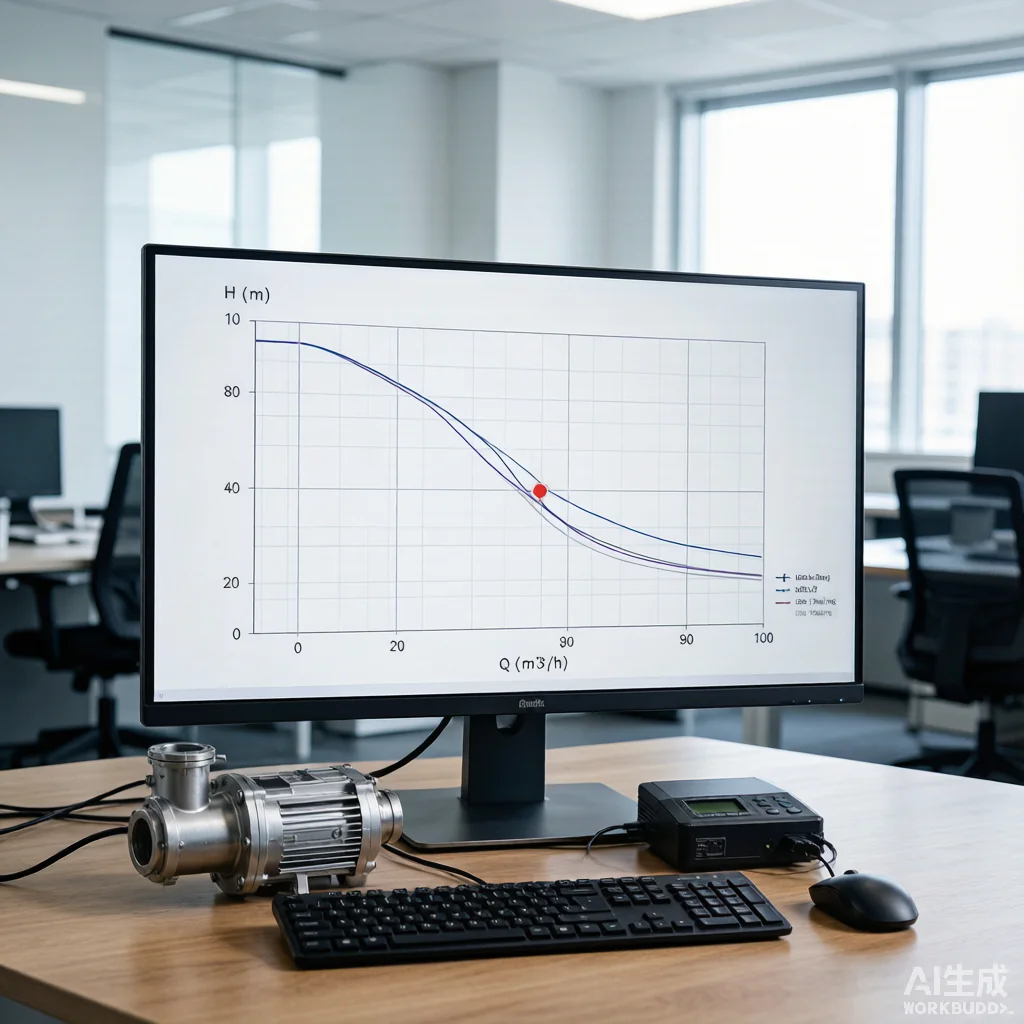
A pump performance curve, often called the Q-H curve, is a graphical representation of how a pump’s flow rate (Q, typically in m³/h) relates to the head (H, in meters) it can achieve. Reading this curve is the first step in any selection process. Manufacturers publish these curves based on controlled laboratory testing at a fixed rotational speed.
A complete pump performance datasheet usually includes three overlapping curves:
- Q-H curve: Shows the inverse relationship between flow and head. At zero flow (shutoff head), the pump produces its maximum pressure. As flow increases, head decreases.
- Efficiency curve (η): An inverted U-shape that peaks at the Best Efficiency Point (BEP). Operating near the BEP minimizes energy waste and extends bearing life.
- NPSH (Net Positive Suction Head) curve: Indicates the minimum suction-side pressure required to prevent cavitation. This is especially relevant for surface-mounted pumps drawing from open water sources.
To read a manufacturer’s curve, locate your required head on the vertical axis, move horizontally to intersect the Q-H curve, then drop down to read the corresponding flow rate. The intersection point is your duty point. Ideally, the duty point should sit within 70–120% of the BEP flow for optimal efficiency. If the duty point falls far to the right of the BEP, the pump is oversized; if far to the left, it is undersized and risks operating at shutoff, which can cause overheating.
Flow Rate vs Head Relationship in Solar Pumps
The relationship between flow rate and head is fundamentally inverse: the higher the head a pump must overcome, the lower the flow it can deliver. This is because the pump’s impeller transfers a fixed amount of energy per unit volume of water. When more energy goes into lifting water against pressure (head), less energy remains to move volume (flow).
In a real-world system, the pump’s Q-H curve does not work in isolation. It intersects with the system curve, which represents the total resistance the piping system imposes. The system curve starts at the static head (the vertical lift when flow is zero) and rises with the square of flow rate due to friction losses. The point where the pump curve and system curve cross is the actual operating duty point.
Worked Example: Consider a KINBO 3HP (2.2 kW) solar submersible pump installed in a borehole with the following conditions: static water level at 40m below the surface, discharge elevation 15m above the surface, horizontal pipe run of 100m in 2-inch PVC pipe, and a required delivery of 5 m³/h. The TDH calculation gives: static head = 40 + 15 = 55m; friction loss at 5 m³/h through 100m of 2-inch pipe ≈ 6m; residual pressure at outlet ≈ 3m. Total TDH = 55 + 6 + 3 = 64m. Adding a 10% safety margin yields approximately 70m.
Reading the manufacturer’s Q-H curve for this 3HP pump at 70m head, the expected flow rate is approximately 4.5 m³/h at peak sunshine. At 60m TDH, the same pump would deliver about 6 m³/h, and at 80m it would drop to roughly 3 m³/h. This demonstrates why accurate TDH estimation is critical — a 10m error in head calculation can change the delivered flow by 30% or more.
How Solar Irradiance Affects Performance
Unlike grid-connected pumps that run at constant voltage and frequency, solar pumps operate on variable DC power that fluctuates with sunlight intensity throughout the day. This variability fundamentally changes how the performance curve should be interpreted.
Solar irradiance has two components: Direct Normal Irradiance (DNI), which is the beam radiation coming directly from the sun, and Diffuse Horizontal Irradiance (DHI), which is scattered light. Solar pump controllers (MPPT-based) primarily utilize the combined global irradiance on the panel surface. At standard test conditions of 1000 W/m², the pump runs at full rated speed and its Q-H curve matches the manufacturer’s published data. At 600 W/m², the pump speed drops, and the entire Q-H curve shifts downward — both head and flow capacity decrease proportionally to the square and cube of speed, respectively (per affinity laws).
Seasonal variation also matters significantly. A system installed at 35°N latitude may receive 30–40% less peak daily irradiance in winter compared to summer, meaning winter daily water output can drop by half. To mitigate this, designers commonly oversize the solar array by 20–30% above the pump’s rated power. This ensures the pump reaches full speed earlier in the morning, maintains it longer into the afternoon, and performs better during partially cloudy conditions. For example, a 3HP (2.2 kW) pump might be paired with a 3.0 kW solar array to ensure consistent performance across a wider irradiance range.
Selection Criteria: Matching Pump to Application Requirements
Proper pump selection requires calculating four key parameters and then cross-referencing them with manufacturer performance data. Skipping any of these steps risks installing a pump that cannot meet daily water demand or that operates inefficiently, shortening its service life.
The selection process follows this sequence: (1) Determine the Total Dynamic Head (TDH) by adding static lift, pipe friction losses, and residual discharge pressure. (2) Define the required daily water volume and convert it to a peak flow rate based on available sunshine hours. (3) Select a pump whose Q-H curve passes through or near your duty point at the BEP. (4) Size the solar array to deliver sufficient power across expected irradiance conditions. Always apply a 10–15% safety margin on both head and flow to account for measurement errors and future system degradation.
For guidance on calculating the head component specifically, refer to our detailed resource on how to calculate required head for solar pump selection. The table below illustrates typical selection scenarios across four common applications:
| Application | Required Head (m) | Recommended Flow (m³/h) | Pump Type | Solar Array (kW) |
|---|---|---|---|---|
| Surface Water (River/Pond) | 10 | 8–12 | Surface Centrifugal | 1.1–1.5 |
| Shallow Well | 20 | 5–8 | Submersible (4-inch) | 1.5–2.2 |
| Medium Borehole | 50 | 4–6 | Submersible (4-inch) | 2.2–3.0 |
| Deep Borehole | 100 | 2–4 | Submersible (6-inch) | 4.0–5.5 |
Note that these are starting reference points. Actual selection should always be verified against the specific manufacturer’s published curves and adjusted for local conditions such as water temperature, pipe material, and array tilt angle.
Frequently Asked Questions
What happens to flow rate when pump head increases?
As pump head increases, flow rate decreases. This inverse relationship is shown on the pump’s Q-H performance curve. For example, a pump that delivers 8 m³/h at 30m head may only deliver 3 m³/h at 60m head. Beyond the shutoff head, flow drops to zero.
How does solar irradiance affect pump performance throughout the day?
Solar pumps operate on variable input power. At peak irradiance (around 1000 W/m²), the pump runs at full speed and delivers maximum flow. During early morning or late afternoon, reduced irradiance means lower pump speed and reduced flow. Oversizing the solar array by 20–30% above the pump’s rated power helps maintain performance during lower-irradiance periods.
How do I calculate total dynamic head (TDH) for my solar pump system?
TDH = static head (vertical distance from water source to discharge point) + friction losses (from pipes, fittings, and valves) + residual pressure head at the outlet. For accurate friction loss estimation, use pipe diameter, length, and flow rate in standard friction loss tables or calculators. Always add a 10–15% safety margin to the calculated TDH.
Need Help Selecting the Right Solar Pump?
The KINBO engineering team is ready to help you analyze your site conditions, calculate TDH, and match the perfect pump to your flow and head requirements. Get expert guidance and full after-sales support.
August 13, 2026 | Author: KINBO Editorial Team
Related Articles