Solar Pump Total Cost of Ownership: Complete Component Breakdown
Introduction
Total Cost of Ownership (TCO) analysis is the definitive framework for comparing solar water pumping systems against conventional alternatives, yet it is frequently oversimplified in procurement decisions that focus narrowly on upfront capital cost. A properly constructed TCO model for a solar pump installation must account for the complete component cost chain — solar PV array, pump and motor assembly, controller/inverter, mounting structures, cabling, borehole development, installation labor, and commissioning — as well as the recurring costs of preventive maintenance, component replacement, and system downtime over a typical 10-20 year service life. When these factors are accurately quantified, solar pumping systems consistently demonstrate TCO advantages of 40-65% over diesel alternatives and 25-40% over grid-connected electric pumps in off-grid or unreliable-grid scenarios. KINBO provides detailed TCO analysis tools to its distribution partners to support customer proposals and tender submissions, ensuring that procurement decisions are based on lifecycle economics rather than initial price alone. This article presents a rigorous component-by-component cost breakdown, compares operating costs across solar, diesel, and grid-electric alternatives, projects maintenance and replacement expenditures, and provides a standardized 10-year TCO analysis framework that procurement professionals can adapt to their specific project parameters.
Table of Contents
Initial Capital Cost Breakdown
The initial capital cost of a solar pumping system can be disaggregated into six primary cost categories, each with distinct cost drivers and procurement considerations. Understanding the relative weighting of these components is essential for procurement professionals seeking to optimize total system cost without compromising reliability.
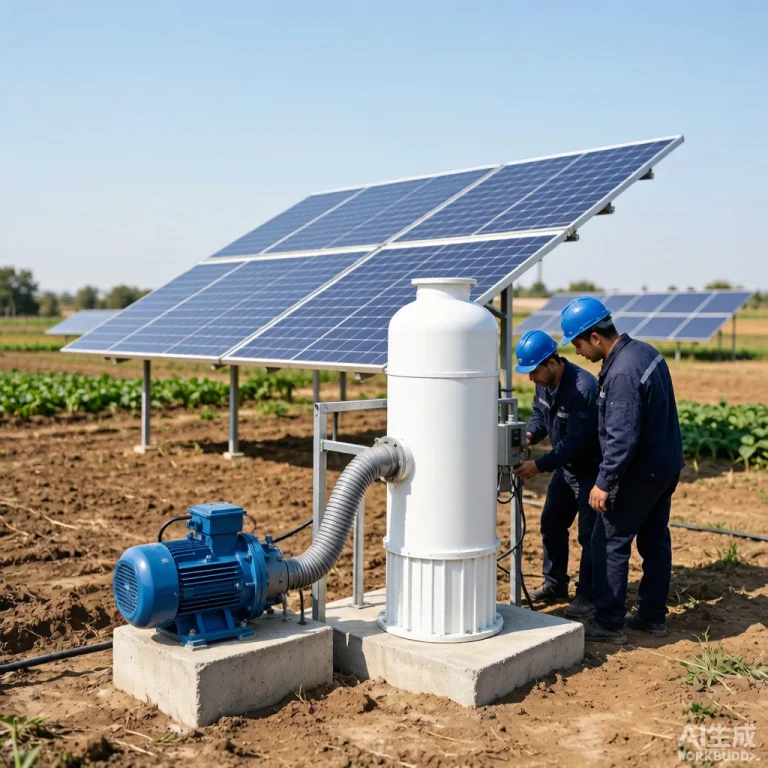
Solar PV Array (35-45% of total system cost): This is the single largest cost component and the one most subject to market price fluctuations. As of Q2 2026, high-efficiency monocrystalline PERC panels rated at 550-600 Wp are available at USD 0.12-0.16 per watt at the factory gate from Tier 1 Chinese manufacturers, with landed costs in Africa and South Asia of USD 0.16-0.22 per watt including freight, duties, and logistics. For a 5.5 kWp system powering a 3 kW pump, the PV array cost ranges from USD 880 to USD 1,210. Panel mounting structures (ground-mount aluminum or galvanized steel frames) add approximately USD 0.05-0.10 per watt, or USD 275-550 for the example system. Procurement optimization in this category centers on panel efficiency: higher-efficiency panels (22%+ vs 20%) reduce the total number of panels and mounting structure required, partially offsetting their higher per-watt cost.
Pump and Motor Assembly (20-30% of system cost): Pump costs scale with power rating, head requirement, and material specification. A 3 kW (4 HP) stainless steel submersible pump with PMSM motor suitable for 80-100 meter head, including 50 meters of drop cable, typically costs USD 900-1,500 at wholesale. The material specification decision — cast iron versus 304 stainless steel versus 316 stainless steel — can swing pump cost by ±30-50% and has a direct impact on service life in aggressive water conditions. KINBO recommends that procurement specifications should not economize on pump metallurgy below the minimum required for the specific groundwater chemistry, as the resulting TCO increase from premature replacement far exceeds the upfront material cost saving.
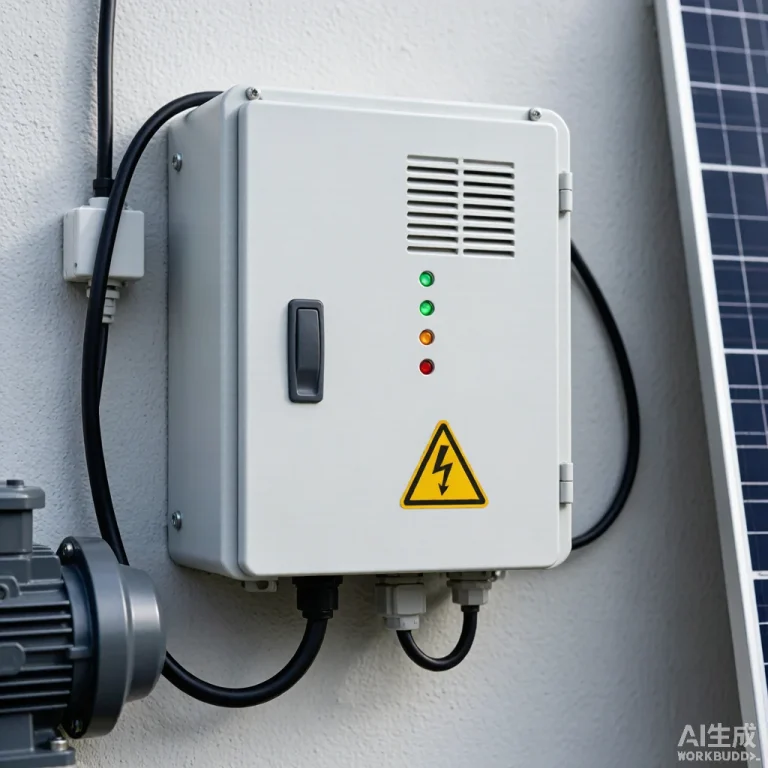
Controller/Inverter (10-15% of system cost): A solar pump controller with integrated MPPT, VFD output, and comprehensive protection features (dry-run, overvoltage, undervoltage, overcurrent, phase loss) for a 3-5.5 kW system costs USD 400-800. Controller cost is a function of output power rating, input voltage range (single-phase vs three-phase DC input), and enclosure protection rating (IP54 for indoor installation, IP65 for outdoor). The incremental cost of upgrading from a basic on/off controller to an MPPT+VFD controller — typically USD 150-300 — is recovered within 12-18 months through improved daily water output, making it one of the highest-return investments in the system.
Installation and Commissioning (10-15% of system cost): Installation costs are highly site-specific and include borehole drilling or existing well rehabilitation, pump setting, PV array installation, electrical wiring, and system commissioning. For a standard installation at an existing borehole, installation costs typically range from USD 500-1,200. If a new borehole must be drilled, this cost increases dramatically to USD 2,000-8,000 depending on depth, geology, and casing requirements, potentially exceeding the cost of the pumping equipment itself.
Operating Cost Comparison: Solar vs Diesel vs Grid
The operating cost comparison between solar, diesel, and grid-electric pumping reveals the fundamental economic advantage of solar technology, but the magnitude of this advantage depends critically on site-specific fuel costs, electricity tariffs, and the reliability of grid power. A rigorous comparison must account for both direct operating costs (fuel, electricity, operator labor) and indirect costs (downtime from fuel shortages or grid outages, generator maintenance, water quality impacts from intermittent pumping).
For a 3 kW (4 HP) pump operating 8 hours per day and delivering approximately 30-40 m³/day against 60 meters of total dynamic head, the daily operating cost comparison is instructive. A diesel-powered equivalent requires a 7.5-10 kVA generator consuming approximately 1.5-2.0 liters of diesel per hour, for a daily fuel cost of USD 12-20 at diesel prices of USD 1.00-1.25 per liter (typical for Sub-Saharan Africa and South Asia). Annual diesel fuel cost thus ranges from USD 3,600-6,000, representing the dominant cost driver that makes diesel pumping economically unsustainable for all but the highest-value applications. Grid-electric pumping at an industrial tariff of USD 0.08-0.15 per kWh consumes approximately 24 kWh daily for a daily cost of USD 1.92-3.60, or USD 576-1,080 annually — a fraction of diesel costs but still significant over a 10-year horizon. The solar pump’s direct operating cost is effectively zero, though this ignores the small labor cost for periodic panel cleaning and system inspection.
The reliability-adjusted cost comparison is even more favorable to solar. In regions where the electricity grid experiences 15-30% downtime during the irrigation season — a common scenario in rural South Asia and Sub-Saharan Africa — the effective cost of grid pumping must account for either lost production during outages or the cost of backup generation. A grid-electric pump experiencing 25% downtime during the critical irrigation season requires either a backup diesel generator (adding capital cost and fuel expense) or accepts a 25% reduction in irrigated area, equivalent to a 25% increase in the effective cost per unit of water delivered. Solar pumping, by operating whenever sunlight is available, eliminates this reliability penalty entirely.
Maintenance and Replacement Cost Projections
Maintenance and replacement costs accumulate differently across the three pumping technologies, with solar systems exhibiting the lowest and most predictable maintenance profile. The maintenance cost comparison must be analyzed at both the annual recurring level and the major component replacement cycle level.
Diesel Pump Maintenance: Diesel generator sets require engine oil and filter changes every 250-500 operating hours, at a cost of USD 50-120 per service including labor. At 8 hours daily operation over a 300-day irrigation season (2,400 hours annually), this translates to 5-10 service intervals annually for a total maintenance cost of USD 400-1,200 per year. Major overhauls — including piston ring replacement, cylinder head reconditioning, and injector servicing — are required every 3,000-5,000 hours (every 1.5-2.5 years) at a cost of USD 600-1,500. Complete engine or generator replacement is typically required every 8,000-12,000 hours (every 3-5 years of continuous irrigation use), representing a capital replacement cost of USD 1,500-4,000. Over a 10-year service life, cumulative diesel generator maintenance and replacement costs range from USD 8,000-20,000, often exceeding the initial capital cost of the generator set itself.
Solar Pump Maintenance: Solar pumping systems have dramatically lower maintenance requirements, but they are not maintenance-free. Annual maintenance activities include panel cleaning (labor cost of USD 50-150 per year depending on local wage rates and soiling conditions), electrical connection inspection and tightening (labor cost of USD 30-80), and performance testing as described in the degradation article (labor cost of USD 50-100). The most significant replacement cost is the pump end itself, with impellers and wear rings typically requiring replacement at 5-8 year intervals depending on water quality, at a parts cost of USD 200-800. The solar controller may require capacitor replacement at 7-10 years (USD 50-150 in parts). Solar panels have a 25-year performance warranty but typically require no maintenance beyond cleaning. Cumulative 10-year maintenance and replacement costs for a well-maintained solar system total USD 1,500-3,500, approximately 15-25% of equivalent diesel system maintenance costs.
10-Year TCO Analysis
Aggregating capital costs, operating costs, and maintenance/replacement costs over a 10-year horizon provides the definitive TCO comparison. The following analysis uses a standardized reference case: 3 kW hydraulic power requirement, 8 hours daily operation over 300 days per year, 60 meters total dynamic head, borehole already existing (drilling cost excluded), and equipment costs at Q2 2026 wholesale pricing for Sub-Saharan Africa/South Asia markets.
| Cost Category | Solar Pump | Diesel Pump | Grid Electric |
|---|---|---|---|
| Initial Capital Cost | $4,200-$6,500 | $2,500-$4,000 | $2,000-$3,500 |
| Pump & Motor | $900-$1,500 | $800-$1,200 | $800-$1,200 |
| Power Source | $1,800-$2,800 (PV) | $1,200-$2,000 (Gen) | $700-$1,500 (Connect) |
| Installation | $800-$1,200 | $300-$500 | $300-$500 |
| Controller/Other | $700-$1,000 | $200-$300 | $200-$300 |
| 10-Year Operating Cost | $500-$1,000 | $36,000-$60,000 | $5,760-$10,800 |
| Fuel/Electricity | $0 | $36,000-$60,000 | $5,760-$10,800 |
| Panel Cleaning/Labor | $500-$1,000 | – | – |
| 10-Year Maintenance | $1,500-$3,500 | $8,000-$20,000 | $2,000-$4,000 |
| TOTAL 10-Year TCO | $6,200-$11,000 | $46,500-$84,000 | $9,760-$18,300 |
| TCO Savings vs Diesel | $40,300-$73,000 | – | $36,740-$65,700 |
The 10-year TCO analysis demonstrates conclusively that solar pumping, despite a higher initial capital investment, achieves payback against diesel alternatives within 12-18 months and against grid-electric alternatives within 3-5 years, depending on local electricity tariffs. Beyond the payback period, the solar system generates cumulative savings that can fund additional productive investments. For procurement professionals presenting business cases to financial decision-makers, the key message is that solar pumping is not merely an environmentally preferable choice but a financially compelling one, with risk-adjusted returns that substantially exceed the cost of capital in most developing economy contexts. KINBO provides customized TCO analysis tools and proposal templates to assist distributors in quantifying these savings for specific customer scenarios.
Frequently Asked Questions
Q: What is the typical payback period for a solar water pump compared to a diesel pump?
A: The payback period — defined as the time required for cumulative operating cost savings to equal the incremental upfront capital cost of the solar system — ranges from 12 to 24 months under typical Sub-Saharan African and South Asian operating conditions. For the reference case analyzed above (3 kW system, 8 hours/day, 300 days/year), the solar system’s incremental capital cost of USD 1,700-2,500 over the diesel alternative is recovered within 12-16 months through fuel cost savings of USD 3,600-6,000 per year. In regions with even higher diesel prices (remote locations where transport costs inflate fuel prices to USD 1.50-2.00 per liter), the payback period shortens to 6-10 months. Conversely, for small systems (below 1.5 kW) where the absolute value of fuel savings is lower, or for seasonal applications operating fewer than 150 days per year, the payback period may extend to 24-36 months but remains well within the 20+ year system service life. The payback analysis should also account for the residual value of the solar system after the analysis period: solar panels retain 80% of their rated output after 25 years and continue producing value, whereas diesel generators depreciate to scrap value within 8-12 years.
Q: Which system components have the highest replacement cost over the pump’s lifetime?
A: The solar PV array, while the largest single capital cost component, actually has the lowest replacement frequency and cost due to its 25+ year service life with no moving parts. The highest replacement cost item is the pump end (impellers, wear rings, diffusers, and shaft), which typically requires partial or complete replacement at 5-8 year intervals depending on water quality. Pump end replacement costs range from USD 200-800 for small systems (0.5-3 kW) to USD 800-2,500 for larger systems (7.5-15 kW). The motor is the second most significant replacement item, with rewinding or replacement costs of USD 300-1,200 typically required at 8-12 year intervals. The solar pump controller ranks third, with capacitor replacement (USD 50-150) at 7-10 years and potential complete controller replacement (USD 400-800 for a 3-5.5 kW unit) at 10-15 years if power electronics degradation exceeds acceptable limits. From a procurement perspective, the material specification of the pump end components — particularly the choice between cast iron, 304 stainless steel, and 316 stainless steel for impellers and wear rings — has the greatest influence on replacement frequency and therefore on lifetime cost. The 20-30% premium for 316 stainless steel construction typically extends pump end life by 50-100% in aggressive water conditions, delivering a positive return on investment within the first replacement cycle.
Q: How do you calculate the levelized cost of water (LCOW) for comparing different pumping technologies?
A: The levelized cost of water (LCOW) is the discounted lifecycle cost per cubic meter of water delivered, providing a standardized metric for comparing technologies with different capital costs, operating costs, and service lives. The calculation is: LCOW = (Total Discounted Lifecycle Cost) / (Total Discounted Water Production). Total Discounted Lifecycle Cost includes initial capital cost (C_cap), plus the net present value of all annual operating and maintenance costs over the analysis period (typically 20 years for solar, 10 years for diesel), minus the discounted residual value of durable assets at end of life. Total Discounted Water Production is the sum of annual water volumes produced, discounted at the same rate. A discount rate of 8-12% is typical for private-sector investments in developing economies, or 5-6% for government and development-financed projects. For the reference 3 kW system producing 9,000 m³/year (30 m³/day × 300 days), with a 20-year analysis period and 10% discount rate, the LCOW for solar pumping is approximately USD 0.04-0.07 per cubic meter. Equivalent diesel pumping LCOW is USD 0.25-0.45 per cubic meter over a 10-year analysis (reflecting the shorter generator service life). Grid-electric pumping LCOW ranges from USD 0.06-0.15 per cubic meter depending on tariff rates and grid reliability. KINBO provides an LCOW calculator tool that accepts site-specific parameters including head, flow, local diesel price, grid tariff, and discount rate to generate customized comparisons for customer proposals.
Ready to build a customized TCO analysis for your solar pump project? Contact KINBO for our TCO calculator tool, product specifications, and distributor pricing.
Related Articles
- Solar Water Pump ROI Analysis: Complete Investment Guide
- Solar vs Grid Electric Pump Cost Comparison: Which is More Economical?